Marketing Alchemy: Turning Your Data Into Customers
tldr
Every company is sitting on data that their customers would kill for. Most companies hoard it, or worse, don’t even know it’s valuable. This post traces how I accidentally stumbled into data marketing at Freightos — starting with a Google Sheet and ending with Amazon as a customer — and unpacks the playbook for turning your own internal data into an owned audience, media coverage, and revenue.The Google Sheet That Changed Everything
In 2016, I had a problem.
I was running marketing at a freight tech company that nobody had heard of. We were selling to logistics professionals — people who had been in the industry for 30 years, who could quote the cost of shipping a container from Shenzhen to Rotterdam off the top of their heads, and who had absolutely zero interest in what some tech guy with a marketing degree had to tell them about their own industry.
I couldn’t out-expert them. I never would. And every blog post we published — “5 Trends in Digital Freight” or whatever — was met with the digital equivalent of a polite nod and a closed browser tab.
So I did something kind of desperate. I opened a Google Sheet.
Every week, I’d go through the Twitter feeds of about 15 industry analysts and journalists, copy every link they shared, and paste it into the spreadsheet. At the end of the month, I’d pick the 10 best articles, write a two-line summary of each, and send it out as an email newsletter.
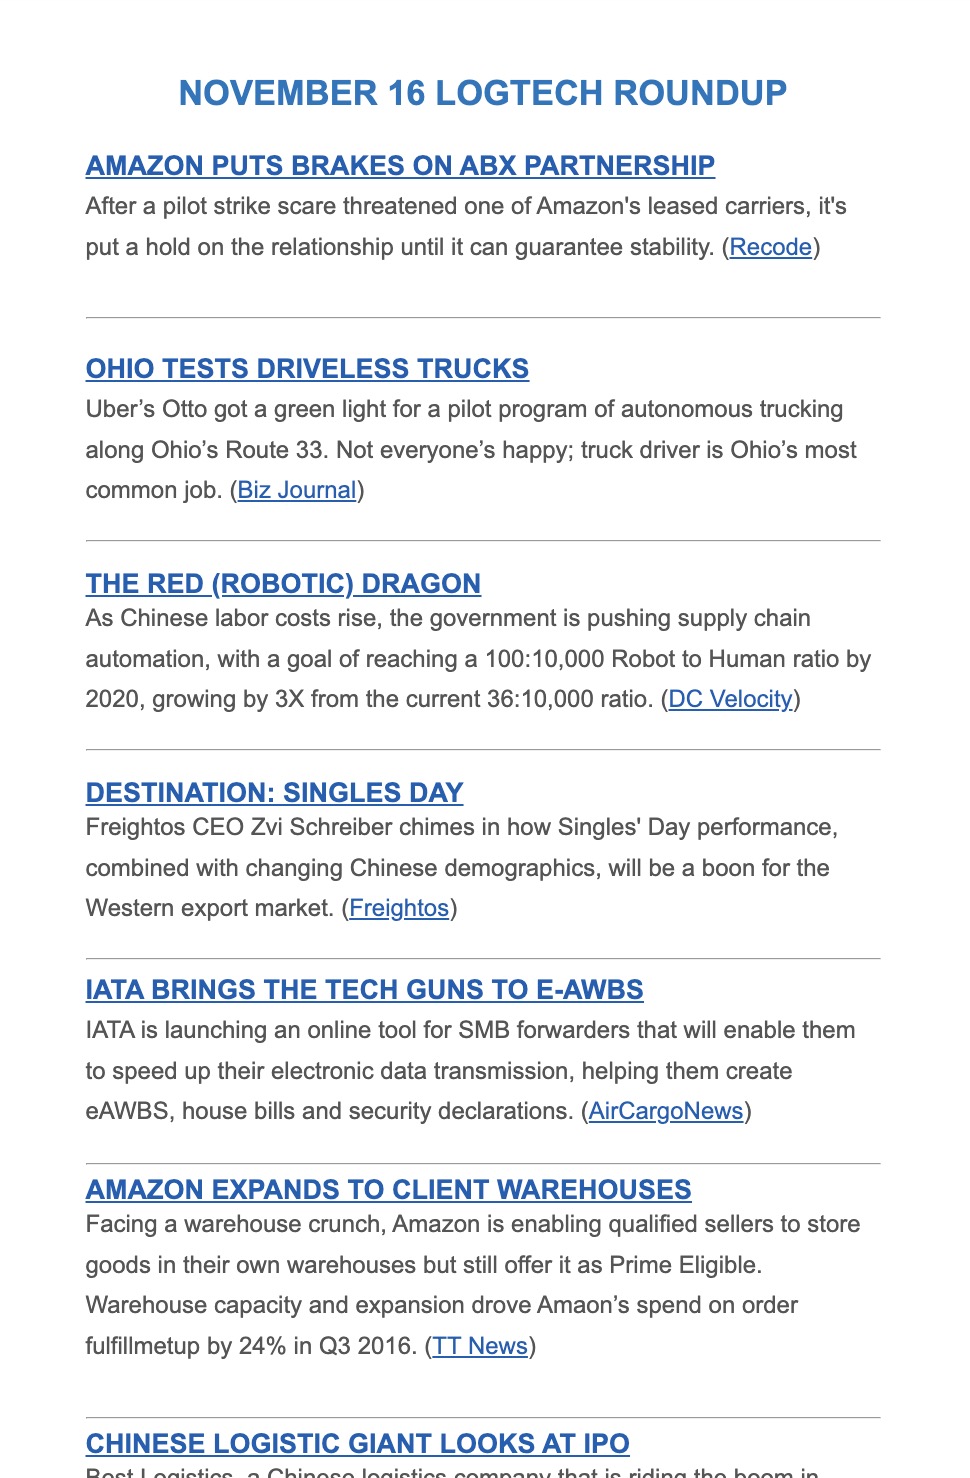
From 2017. Not super impressive, eh?
That’s it. That was the whole strategy. A dude with a spreadsheet, curating other people’s work.
And it started working. Not because of anything I wrote. But because these logistics veterans — the people who out-expertered me on every possible topic — had the same problem everyone has: they were drowning in information and starving for insight. They didn’t need me to teach them about freight. They needed someone to sift through the noise and hand them the signal.
Within a few months, I had a small but weirdly engaged audience. Industry people I’d never met were replying to the emails. Some of them were forwarding it to colleagues. A few reporters subscribed.
I didn’t know it yet, but I had accidentally stumbled onto the most powerful marketing engine I’d ever build.
I just needed one more ingredient.
The Most Valuable Thing Your Company Doesn’t Know It Has
Let me take a detour for a second, because this idea is bigger than my freight newsletter.
Think about what your company actually knows — not what’s on your blog, but what’s in your database. The raw, messy, aggregated, anonymized exhaust of your product doing its thing.
- If you’re an e-commerce platform, you know what’s selling and where.
- If you’re a cybersecurity company, you know which attack vectors are surging.
- If you’re a CRM, you know how sales teams actually behave (not how they say they behave).
- If you’re a logistics platform — you know what it costs to move stuff around the world.
Now here’s the thing: your customers already want this information. They’re making decisions with it, or trying to. They’re paying consultants for worse versions of it. They’re Googling for it and finding SEO garbage from sites that have never shipped a container or closed a deal or blocked a cyberattack.
And you’re just… sitting on it.
Open up the Wall Street Journal, the Economist, or the New York Times on any given day. Count how many articles cite corporate data. It’s a shocking number. This isn’t lazy journalism — it’s because companies are sitting on incredibly unique datasets, and the ones smart enough to share them get to shape the narrative.
Zillow figured this out 25 years ago. They were sitting on aggregated data about home sale prices. At the time, getting that data meant paying a firm or knowing a real estate insider. So Zillow just… published it. For free. The Zillow Home Value Index.
Think about what that did:
- Real estate agents needed the data → they came to Zillow → Zillow monetized them
- Reporters needed housing market numbers → they cited Zillow → readers saw Zillow as the authority
- Homeowners wanted to know what their house was worth → they came to Zillow → Zillow captured the demand
The data was the product. The data was the marketing. The data was the brand. All at once.
Google Trends, Semrush Sensor, AppsFlyer’s Performance Index, LinkedIn’s Workforce Report, Spotify Wrapped, Uber Movement — they all figured out the same thing. Give away the data exhaust, keep the customers it attracts.
But here’s what nobody tells you about this strategy: you don’t start with the Zillow Home Value Index. You start with a Google Sheet. And a slow, clumsy crawl toward something much bigger.
Why Data (and Not Just “Good Content”)
Before I walk through how this actually works, let me explain why data specifically — and not just “great content” — is the play here. Because “drive value with content” has become such a truism that it effectively means nothing. Everyone’s nodding along. No one knows what it means.
Data is different from regular content in three ways that actually matter:
First, data has a natural filter built in. A blog post about “supply chain trends” attracts everyone from college students writing papers to your mom who’s vaguely curious. A chart showing container shipping rates from Shanghai to Los Angeles over the past 90 days? That attracts exactly the people you want to sell to, and repels everyone else. The data is the targeting.
Second, data has an expiration date — and that’s a feature. A blog post gets published, gets some traffic, and slowly decays. Data that updates weekly or monthly creates a reason to come back. It’s the difference between a movie (watch once) and a TV series (tune in every week). You’re building a habit, not a one-time visit.
Third — and this is the sneaky one — data creates dependency. Once someone starts using your freight rate index in their quarterly reports, or citing your cybersecurity threat data in their board presentations, or referencing your home value index in their client pitches… they can’t stop. You’ve become infrastructure. You’ve gone from “a company I’ve heard of” to “a source I depend on.”
That last one is the whole game. And it took me years to understand it.
How I Backed Into a Data Empire (A Story in Three Tiers)
Okay, so let me tell you how the Google Sheet turned into something much, much bigger. And I want to be honest here: I didn’t have a master plan. I had a series of “well, what if we tried…” moments that compounded over years. I’m going to reverse-engineer it into a clean three-tier framework, but know that the actual experience was messier, slower, and punctuated by many more failures than I’m about to describe.
One important caveat before we dive in: using internal data externally should be done carefully. Never expose customer data or anything that could be perceived as too sensitive. It’s not worth the attention, I promise. Okay, here we go.
Tier 1: Give Them a Number They Can’t Get Anywhere Else
Remember that curated newsletter I started? It worked for getting attention, but it had a ceiling. I was aggregating other people’s insights. Anyone could do that. And the moment someone with a bigger email list started curating the same links… I was toast.
But by that point, Freightos had started accumulating something nobody else had: real transaction data on what it costs to ship freight around the world. Not estimates. Not surveys. Actual prices from actual bookings on our platform.
So we started publishing monthly freight rate averages on the major global trade lanes. China to the US West Coast. Europe to South America. The big ones.
Now, on its own, a single monthly number isn’t that exciting. “The average cost to ship a 40-foot container from Shanghai to LA was $3,200 in March.” Okay, cool. Nobody’s calling the press about that.
But here’s what happened. We backfilled historically. So now it wasn’t just “$3,200 in March” — it was “$3,200 in March, up 12% quarter-over-quarter and down 34% year-over-year.” Suddenly you’ve got a story. Is freight getting more expensive? Is the pandemic effect fading? Is that canal blockage going to move the needle?
We wrapped those numbers in a newsletter with a paragraph or two of editorial — just enough context to make the data useful — and sent it out alongside our curated industry roundup. We also created a shorter, no-fluff version for reporters, because journalists don’t want your marketing copy. They want the number and a quote.
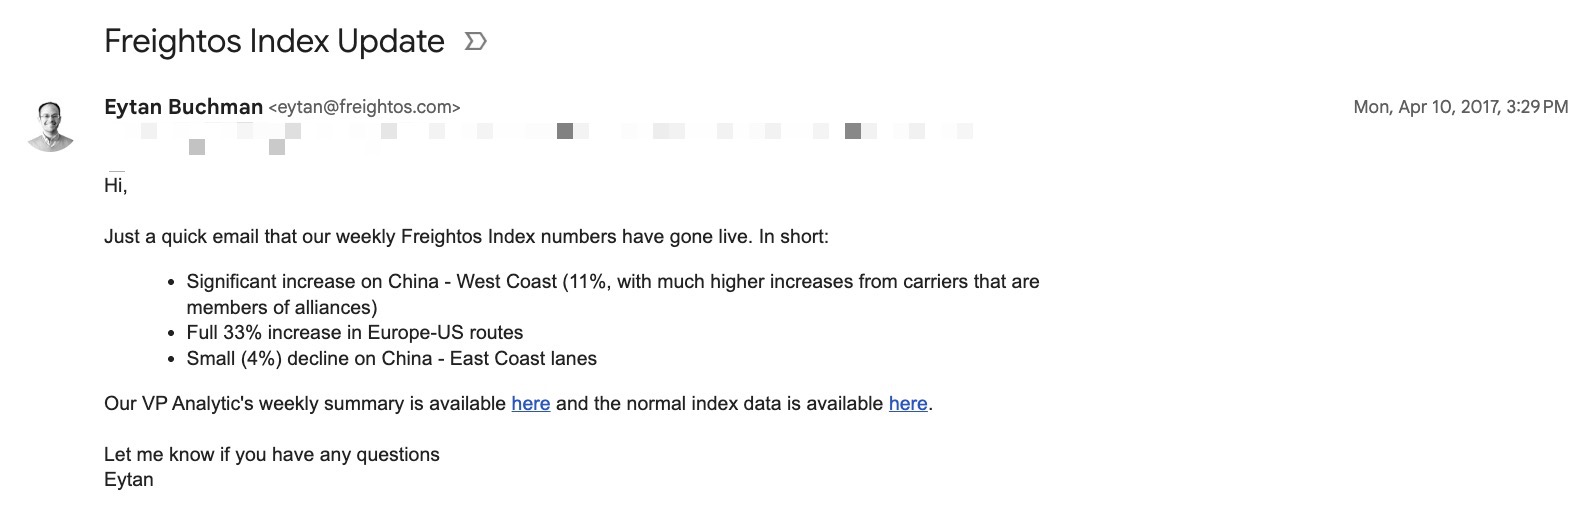
The first (and very janky) email I sent out to reporters about this.
This is the critical first tier: find the number your industry is missing, and give it away for free.
You don’t need proprietary data to start. You can aggregate public data, run a survey, or analyze patterns nobody’s bothered to look at. I’ve seen companies scrape job postings to identify hiring trends, analyze SEC filings for investment patterns, or simply ask their customers smart questions and publish the results. (For the survey approach, I wrote up a whole method for that called the Expertise Amplification Method.)
A good litmus test: would a reporter covering your sector be excited to get this data? If the answer is yes, you’re onto something.
What you’re building at this stage isn’t revenue. It’s credibility. You’re becoming the company that has the number. And once you’re the company that has the number, something interesting starts to happen…
Tier 2: The Number Becomes a Habit
Our monthly freight data newsletter was getting solid traction. Open rates above 30%. Subscribers growing week over week. Industry people citing our numbers at conferences we weren’t even attending.
So we did what felt natural: we went weekly.
This is where things get interesting — and where most companies stall out, because going from monthly to weekly means going from “a thing we produce” to “a machine that runs.” If you don’t playbook it, it will eat your marketing team alive.
Here’s what we did. We identified 3-5 sub-data points that were more granular than the headline number. Think of it like the difference between the Zillow US housing index and the San Francisco housing index. The national number is interesting at dinner parties. The city-level number is what a real estate agent actually needs.
For us, that meant breaking down rates by specific trade lane, adding transit time data, and flagging outlier routes where costs were spiking. Suddenly, a logistics manager in Hamburg could open our email and immediately see whether Asia-to-Europe rates were moving in a way that affected their purchasing decisions.
We templated the editorial so it wasn’t a creative lift every week. A personal line from the person whose name was on the email (important — people follow Anderson Cooper, not CNN), a data summary, a few lines of context, and a product mention at the bottom. Rinse, repeat.
And then the flywheel kicked in.
Reporters started finding us organically. Not because we pitched them — because they were Googling for freight data and we were the only ones publishing it consistently. A journalist working on a story about rising shipping costs would search for the data, find our newsletter archive, cite us, and link to us. Their readers would subscribe. Our subscriber count grew. Our domain authority improved. More journalists found us.
Data → Media → Subscribers → More data distribution → More media. Each revolution of the wheel spun faster than the last.
We expanded into new formats — programmatic SEO pages (one thin page per trade lane, Mad Libs-style variable copy, a chart, and a CTA — this was my holy grail), webinars, blog posts, on-demand data pulls for reporters on deadline. We baked the data into sales decks. We put it in email signatures.
But the real unlock was something we didn’t plan for at all.
Tier 3: When the Data Becomes the Product
Here’s where the story gets weird.
We had built a weekly newsletter with 50,000+ subscribers and 40% open rates. We had hundreds of media mentions a year, the vast majority coming in with zero outreach from our team. The data had become a fixture.
And then people started asking: “Can I just… look up any route myself? On a website?”
So we built one.
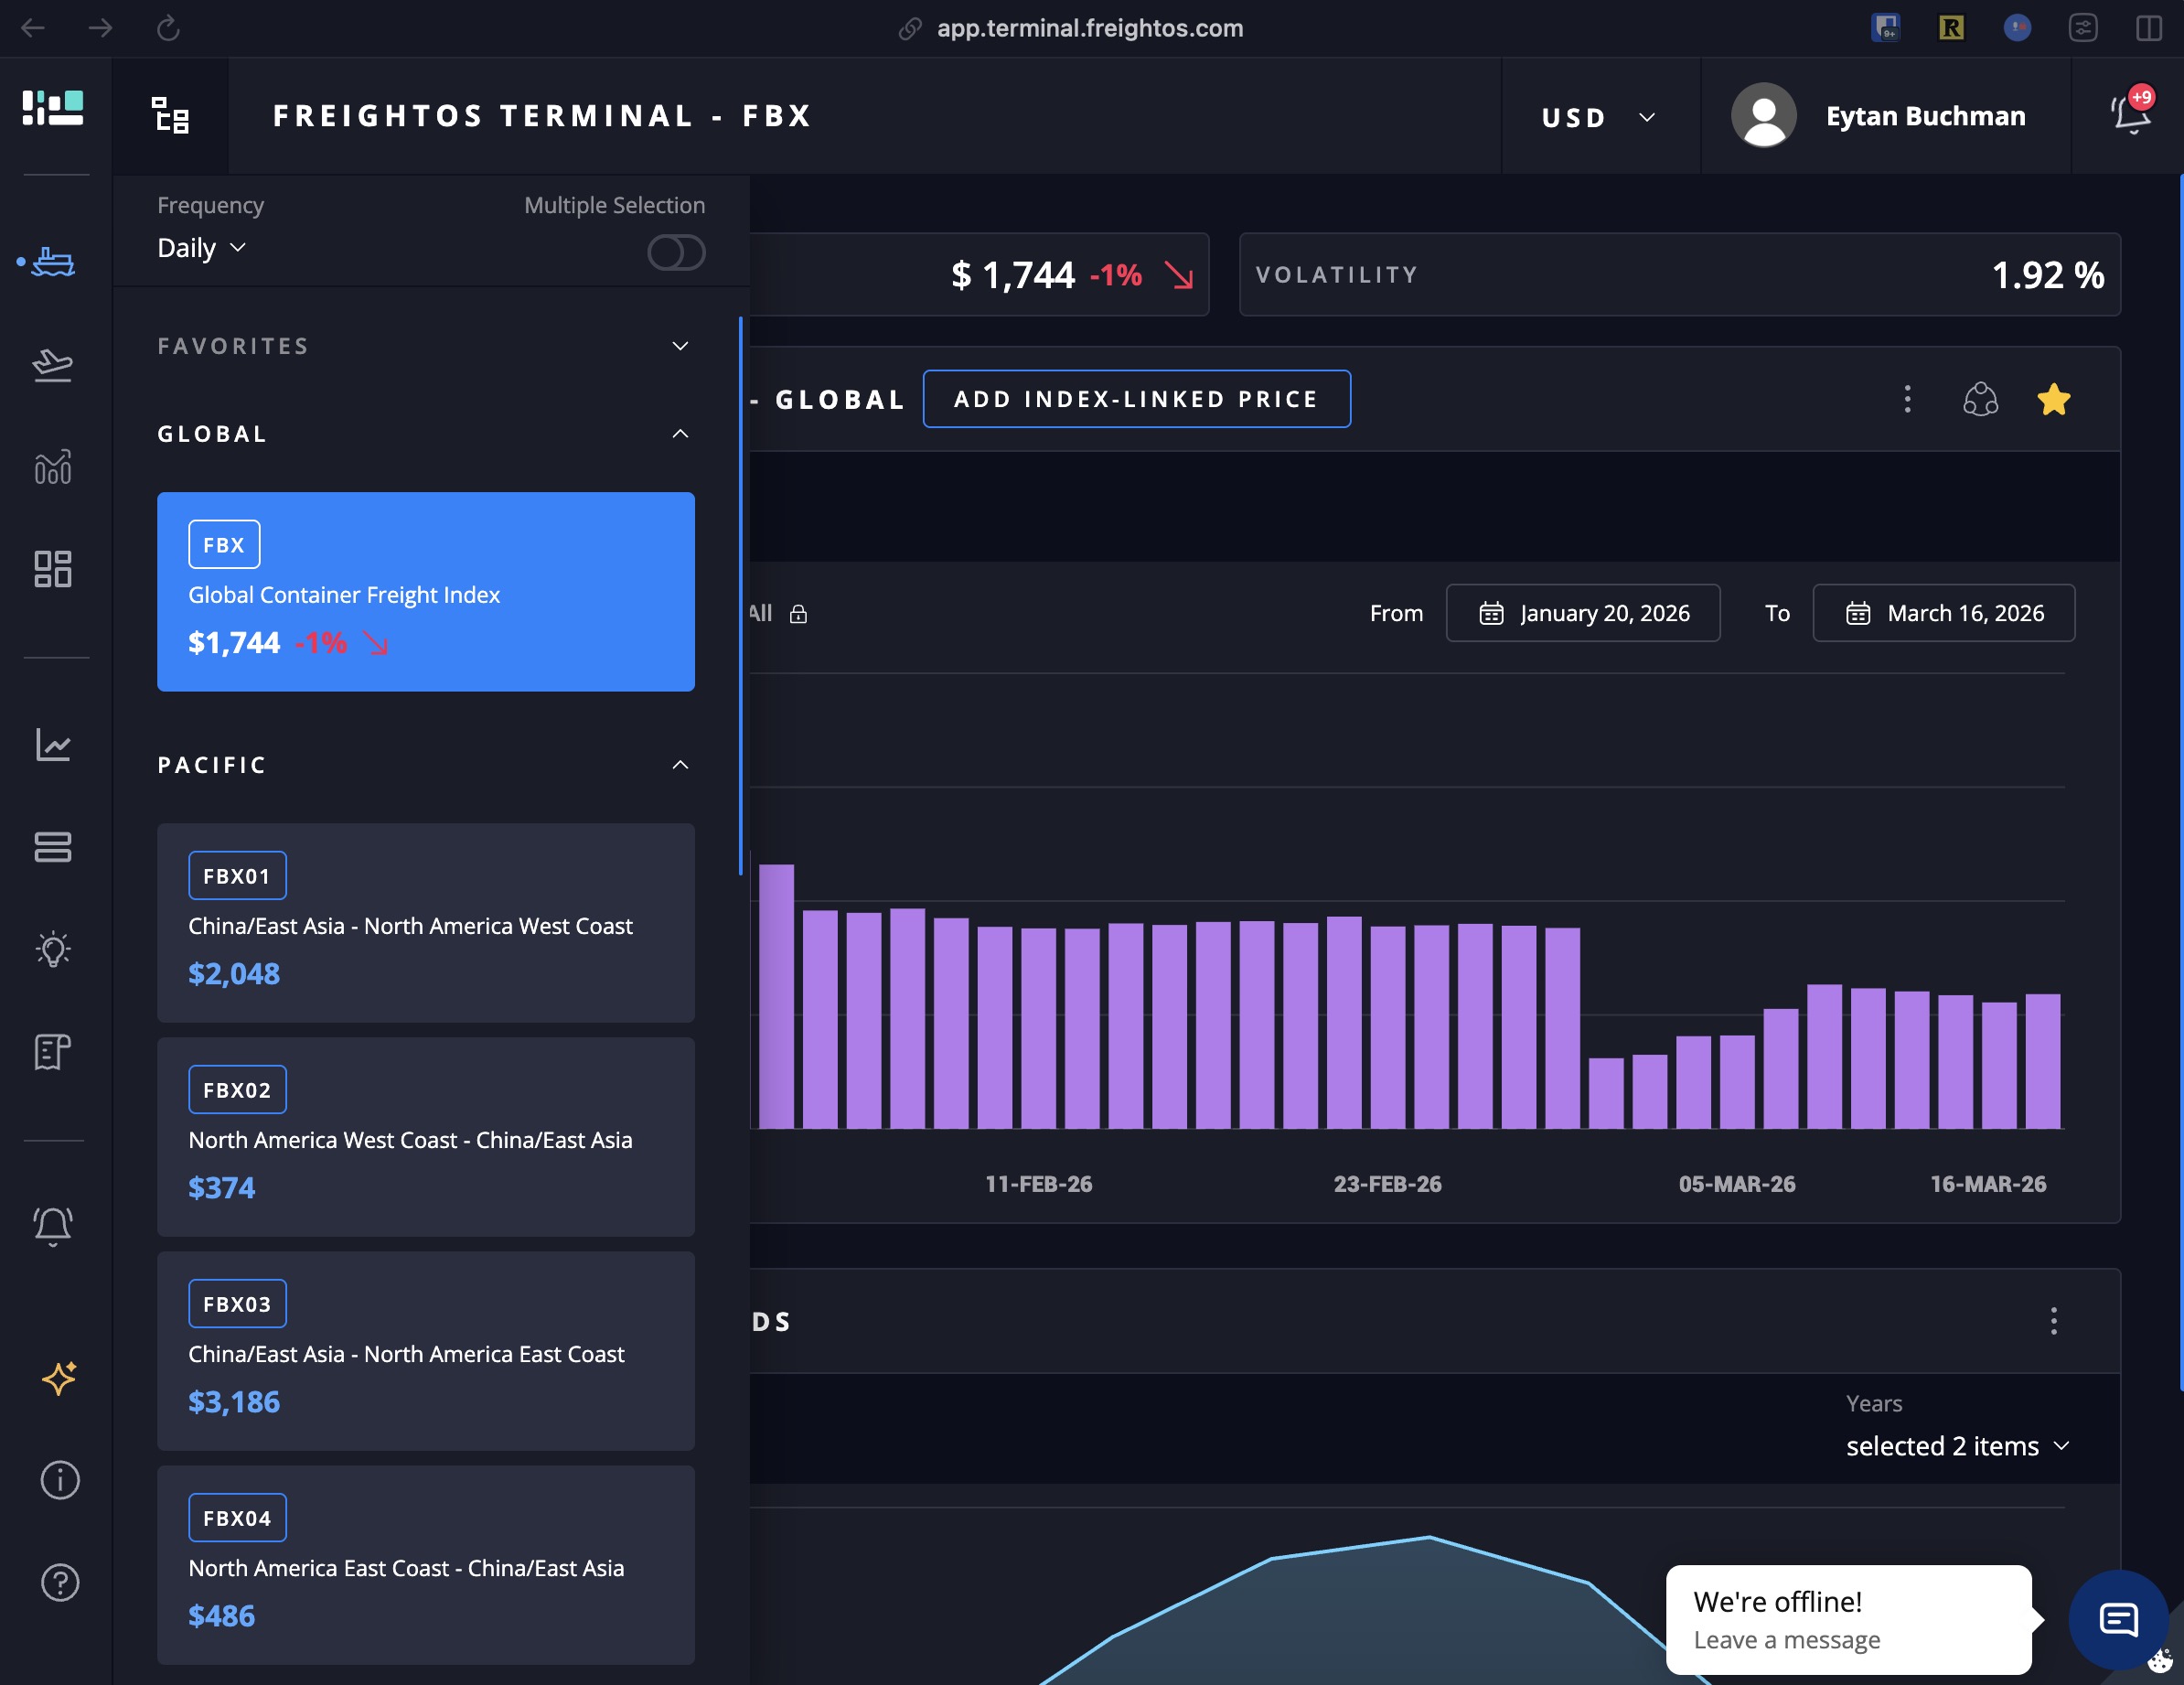
What Freightos Terminal looks like in 2026.
A self-service data portal with programmatic landing pages for every major trade lane. Shanghai to LA. Rotterdam to New York. Mumbai to Felixstowe. Hundreds of pages, each with live pricing data, historical charts, and — of course — a CTA to use our actual freight booking platform.
This triggered an SEO snowball that I still find hard to believe. Reporters who previously found us through the newsletter were now finding us through Google. They’d cite us. The backlinks improved our domain authority. Higher authority meant we ranked better. Better rankings meant more reporters found us. The flywheel had a flywheel.
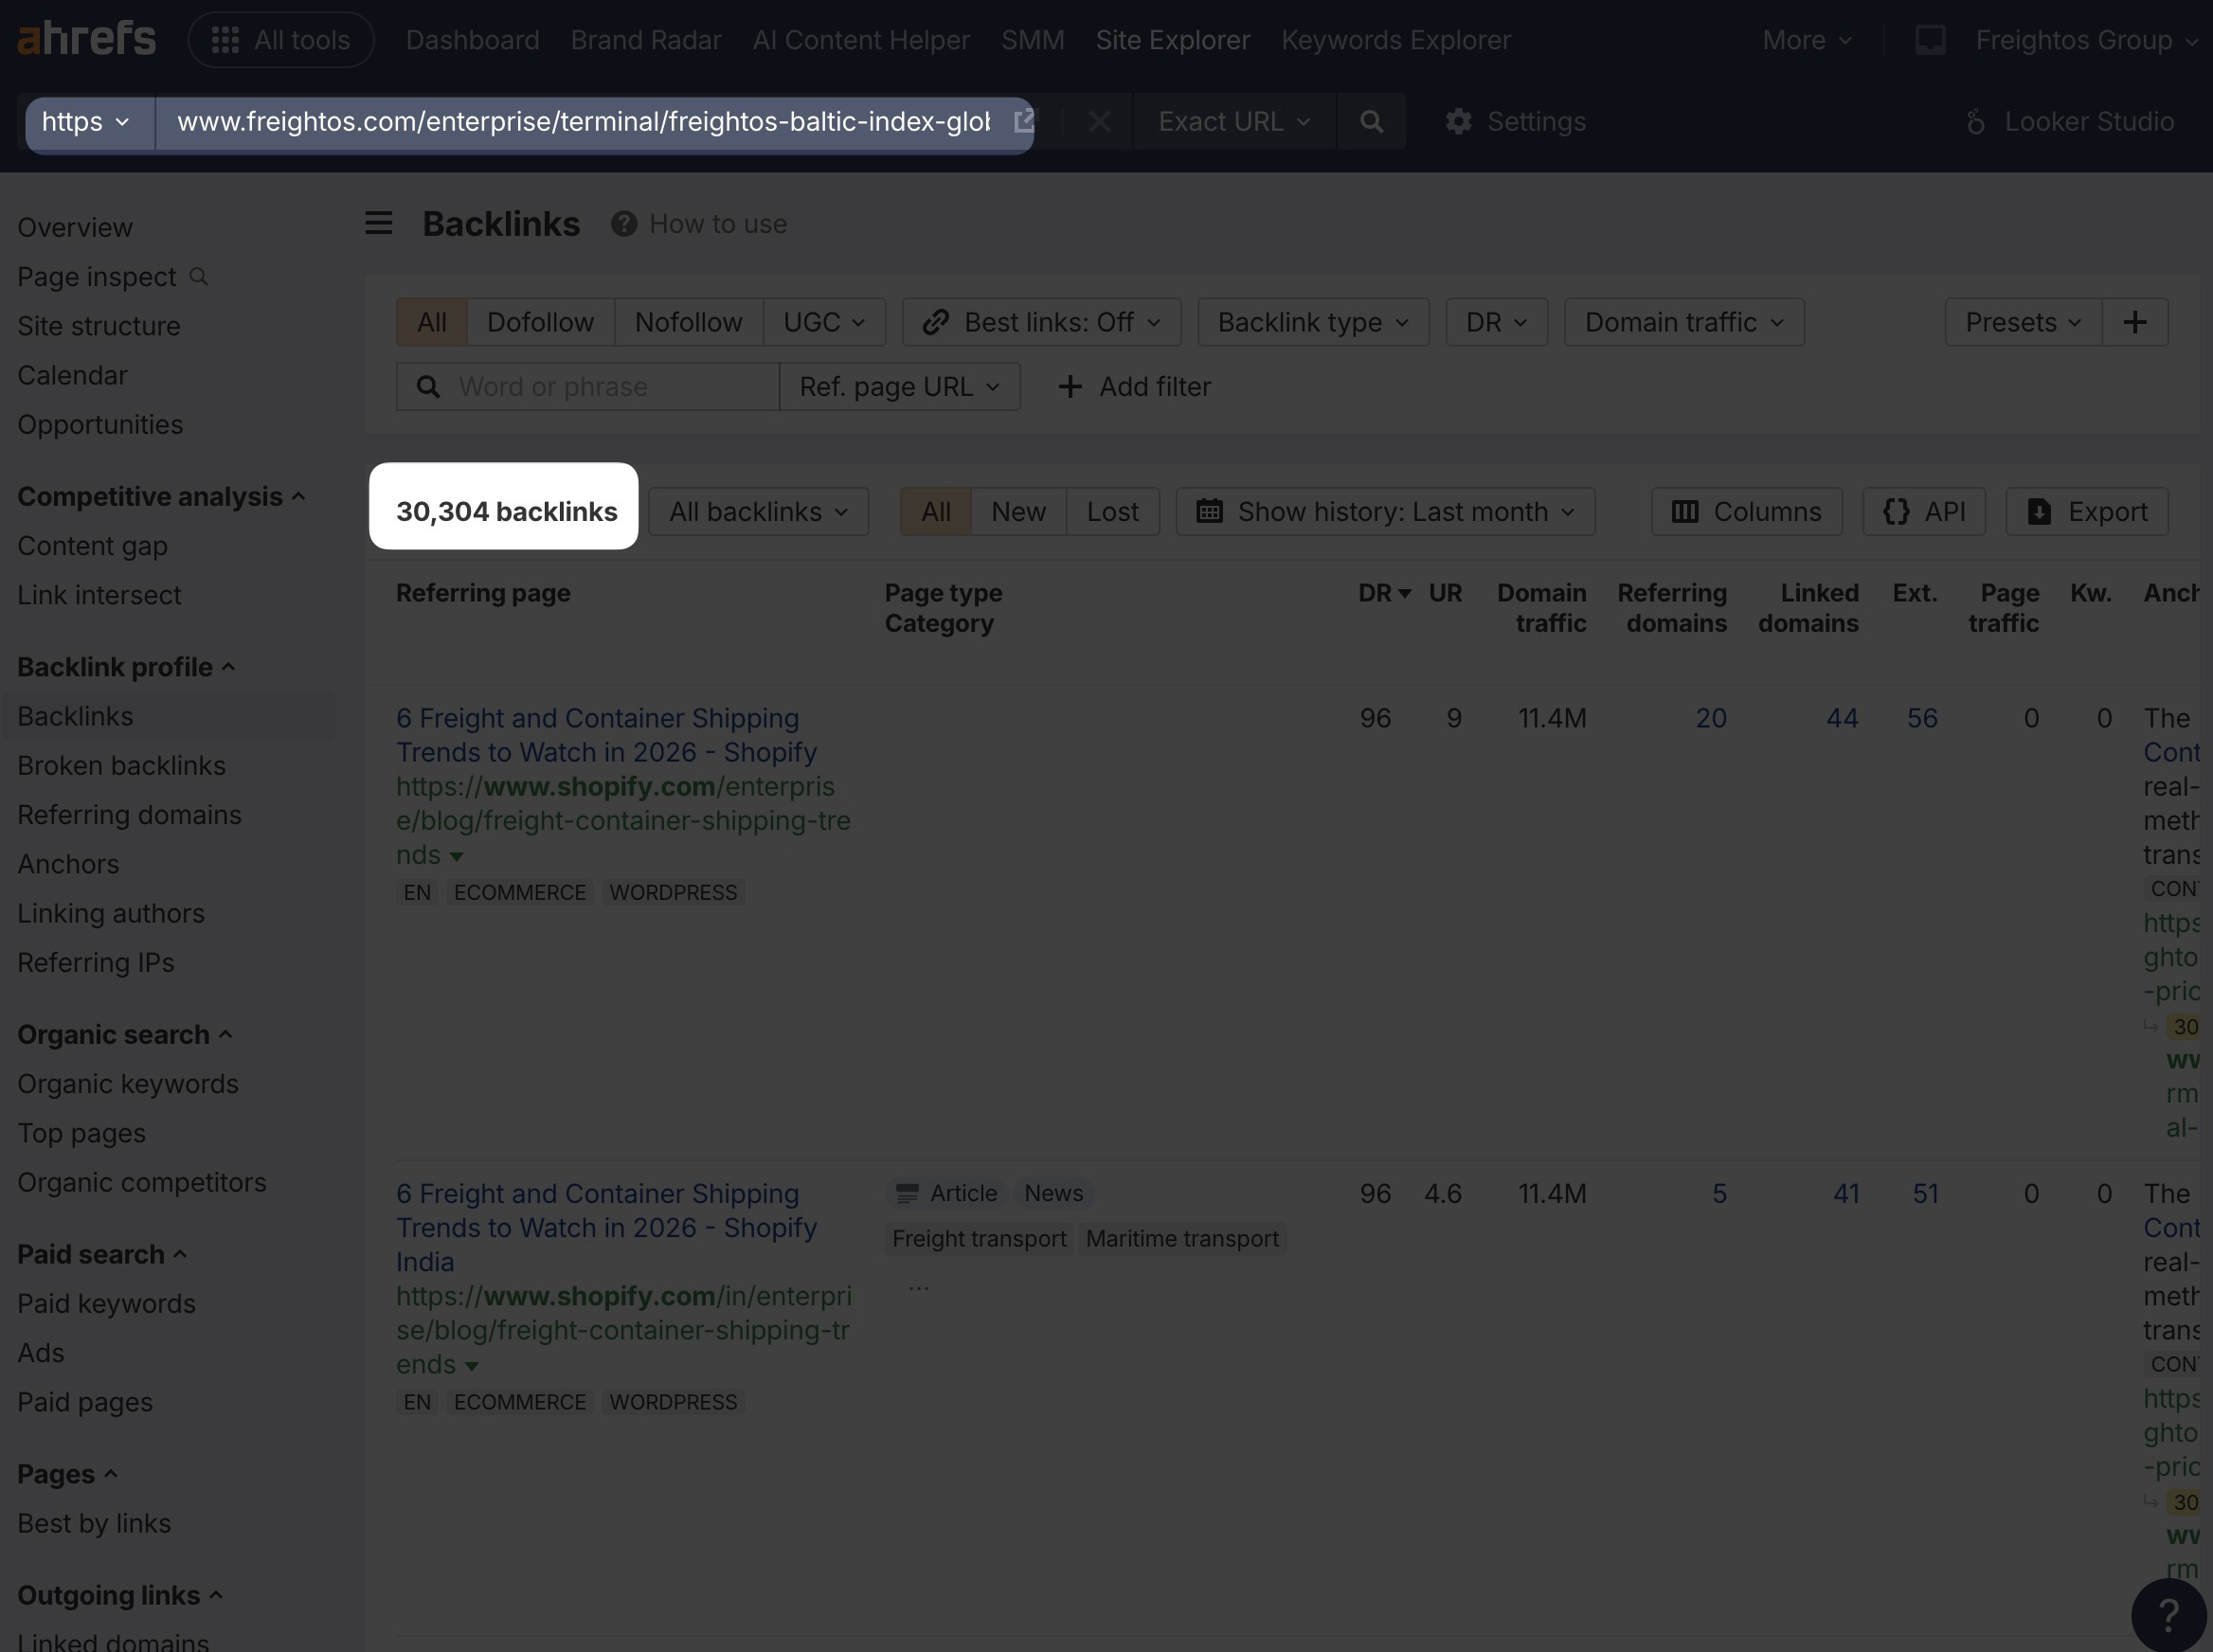
Guess people like the data.
We started upselling reporters on adjacent datasets. “You’re interested in shipping rates? We also have transit time data. And port congestion metrics. And carrier reliability scores.” Whatever they kept asking for, we productized.
By 2023, this is where we’d landed:
- 50K+ newsletter subscribers with 40%+ open rates
- A high-traffic data website driving dozens of enterprise registrations daily
- A separate data sales business with customers like Amazon and UPS
- Hundreds of mainstream media mentions annually, the vast majority requiring zero outreach
Let me say that again: the marketing strategy became a business unit. Amazon is a paying customer of data that started as a marketing newsletter built from a Google Sheet.
The Part Where I Tell You What This Actually Requires
I just told you a story with a happy ending. Let me balance that with some brutal honesty about what this takes.
Time. This was not a quarter-long experiment. From the first curated newsletter to the self-service data portal was roughly 5-6 years. The first 18 months felt like shouting into a void.
Discipline. Sending a data update every week, without fail, for years — even when open rates plateau, even when your CEO asks why you’re spending time on a newsletter instead of a product launch, even when you personally are bored of writing about container shipping rates for the 200th time — requires a specific kind of stubbornness.
The right data. Not every company has data worth publishing. If your data is too far removed from what you actually sell, you’ll build an audience you can’t convert. We made this mistake early — I once got us a Wall Street Journal mention for a data analysis that had almost nothing to do with our product. Great for the ego. Useless for the pipeline.
Internal buy-in. Someone in your company is going to be nervous about giving data away for free. “Aren’t we helping our competitors?” The answer is usually no — the competitive advantage is in the product, not the data exhaust — but you’ll need to make that case, probably more than once.
And the right person. Think carefully about who signs these emails and talks to reporters. If this works, they’re going to become a visible industry voice. That person needs to be credible, available, and — this is the part people forget — actually interested in the subject matter. Faking enthusiasm for weekly freight rate data for five years straight is not possible.
So What Do You Do Monday Morning?
If you’ve read this far and you’re thinking “okay but I don’t have Freightos’s data,” I want to offer some encouragement: I didn’t either, when I started.
Start with what you have. Here’s the sequence:
Step 1: The audit. Sit down with your product team and ask: what do we know about our industry that our users would find interesting? What data do we generate, even as a byproduct, that shows what’s happening in our space? Where does what we know overlap with what keeps our users up at night? Don’t overthink it — the overlap is usually closer than you think.
Step 2: The bootstrap. If you don’t have proprietary data yet, curate. Aggregate. Survey. Create value by being the person who filters signal from noise in your industry. Build the audience first, get the data later.
Step 3: The first number. Find one metric you can publish monthly. Backfill it. Editorialize around it. Send it to 50 people. Then 500. Then 5,000.
Step 4: The habit. Go weekly. Template it. Make it a machine, not a project.
Step 5: The portal. When people start asking “can I look this up myself?” — build them the thing they’re asking for.
The whole trick, if there is one, is understanding that you’re not creating content. You’re building infrastructure. Content gets consumed and forgotten. Infrastructure gets depended on. And once someone depends on you, you’re no longer competing for their attention.
You’ve already won it.
This playbook was developed over ~7 years at Freightos, starting with a Google Sheet and ending with Amazon as a data customer. I’ve compressed years of trial and error into a clean narrative here, so please take the tidiness with a grain of salt — the actual journey involved more dead ends, bad ideas, and late nights than I’ve let on. If you want to go deeper on the media side of this, check out my post on 5 PR truths that actually work. And if you’re wondering how to build the content itself when your audience knows more than you, the Expertise Amplification Method is a good companion piece.
If this was useful, share it with a friend. Or send me 🍕.
Frequently Asked Questions
What is data marketing and how does it work?
Data marketing is using your company’s proprietary data as a content asset — publishing it as market intelligence that your buyers and the press don’t have access to elsewhere. It works because proprietary data is a moat: it can’t be replicated by a competitor or summarized by ChatGPT. The three-tier model goes from raw data publication to habitual data consumption to data as product.
What kind of data can a B2B company use for data marketing?
Transaction data (prices, volumes, velocity), behavioral data (how customers use the product), outcome data (what results customers achieve), and operational signals (capacity, demand, timing) are the most common starting points. The filter is: does this data tell your buyer something true about their own market that they can’t easily get elsewhere?
How long does it take to build a data marketing engine?
The first asset — typically a data report or index — can be published within 30-60 days of identifying the right dataset and establishing a publication format. Building habitual audience dependency (Tier 2) takes 6-12 months of consistent cadence. Reaching Tier 3 — where the data becomes a standalone product — is a multi-year effort. Most B2B companies should target Tier 1 and Tier 2 as realistic 12-month goals.
Do you need a data team to run data marketing?
Not at the outset. The first-tier play often starts with a simple aggregation or summary that a marketer can pull from existing reporting. You need a data team to scale — to run statistical analysis, build automated report pipelines, and launch an API. But the first version is often a spreadsheet that a marketer refreshes monthly.
What's the difference between data marketing and content marketing?
Content marketing uses words, frameworks, and arguments to earn attention. Data marketing uses numbers and evidence. They’re not mutually exclusive — the best data marketing wraps data in strong narrative. But the data is load-bearing: it’s the primary credibility driver, not the writing. If you stripped the data out of a data marketing asset, there’d be nothing left.
Let's make a deal. Drop your email and I'll let you know when I post new insights.